Technomic
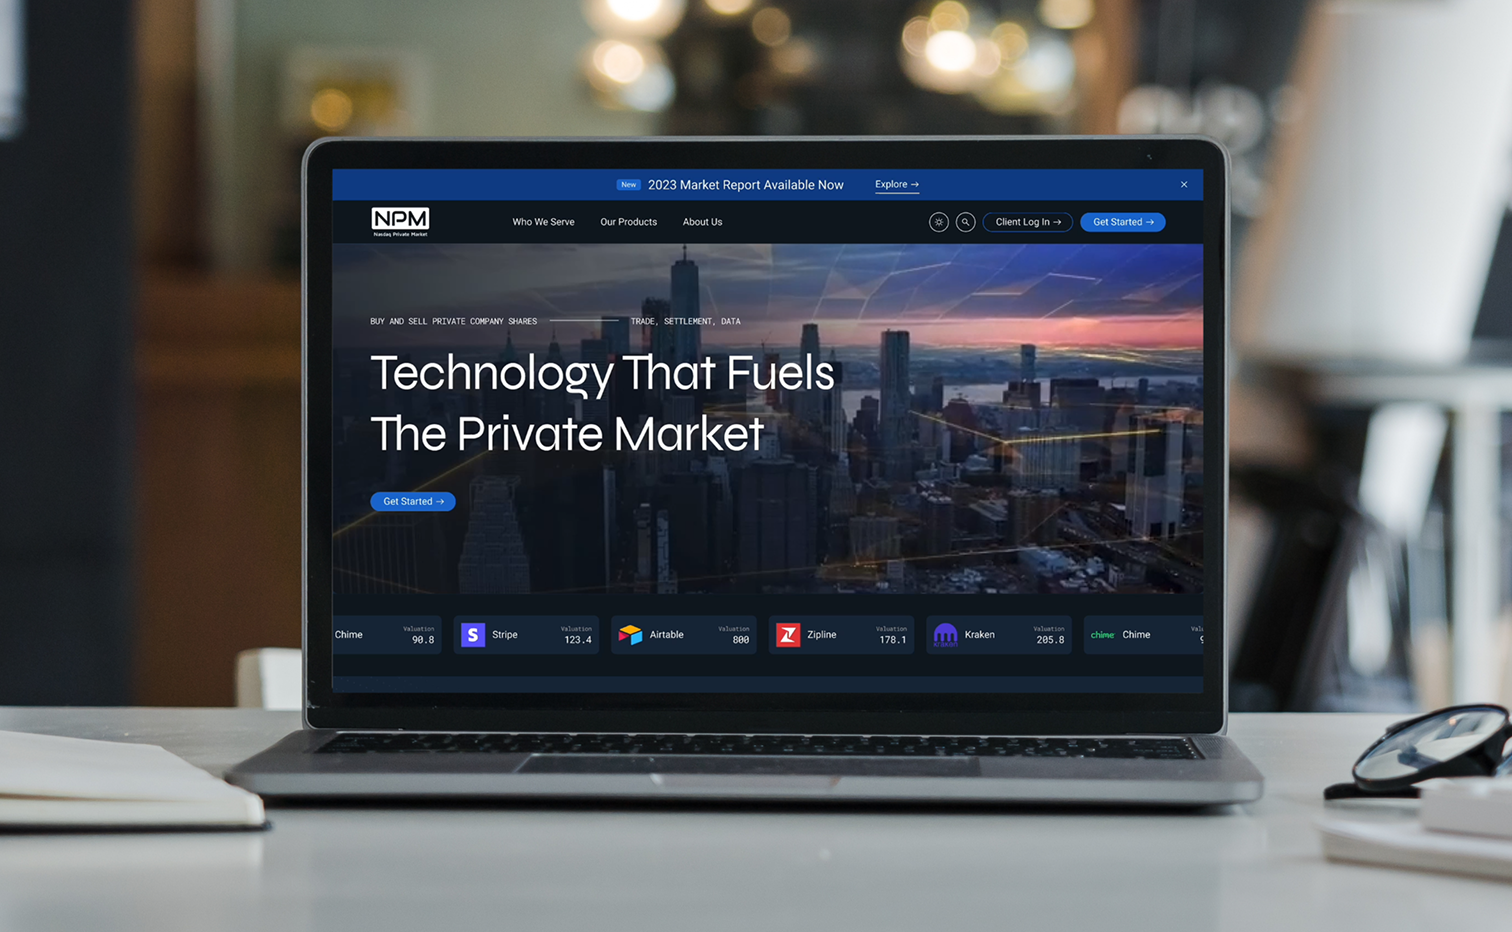
Technomic, a provider of forecasting, consumer data, menu insights, and advisory services to thousands of foodservice professionals, partnered with HTEC to redesign their online platform and expanded to a partnership for creating new features and dashboards.
Technomic

Technomic, a provider of forecasting, consumer data, menu insights, and advisory services to thousands of foodservice professionals, partnered with HTEC to redesign their online platform and expanded to a partnership for creating new features and dashboards.
Making sense of the data
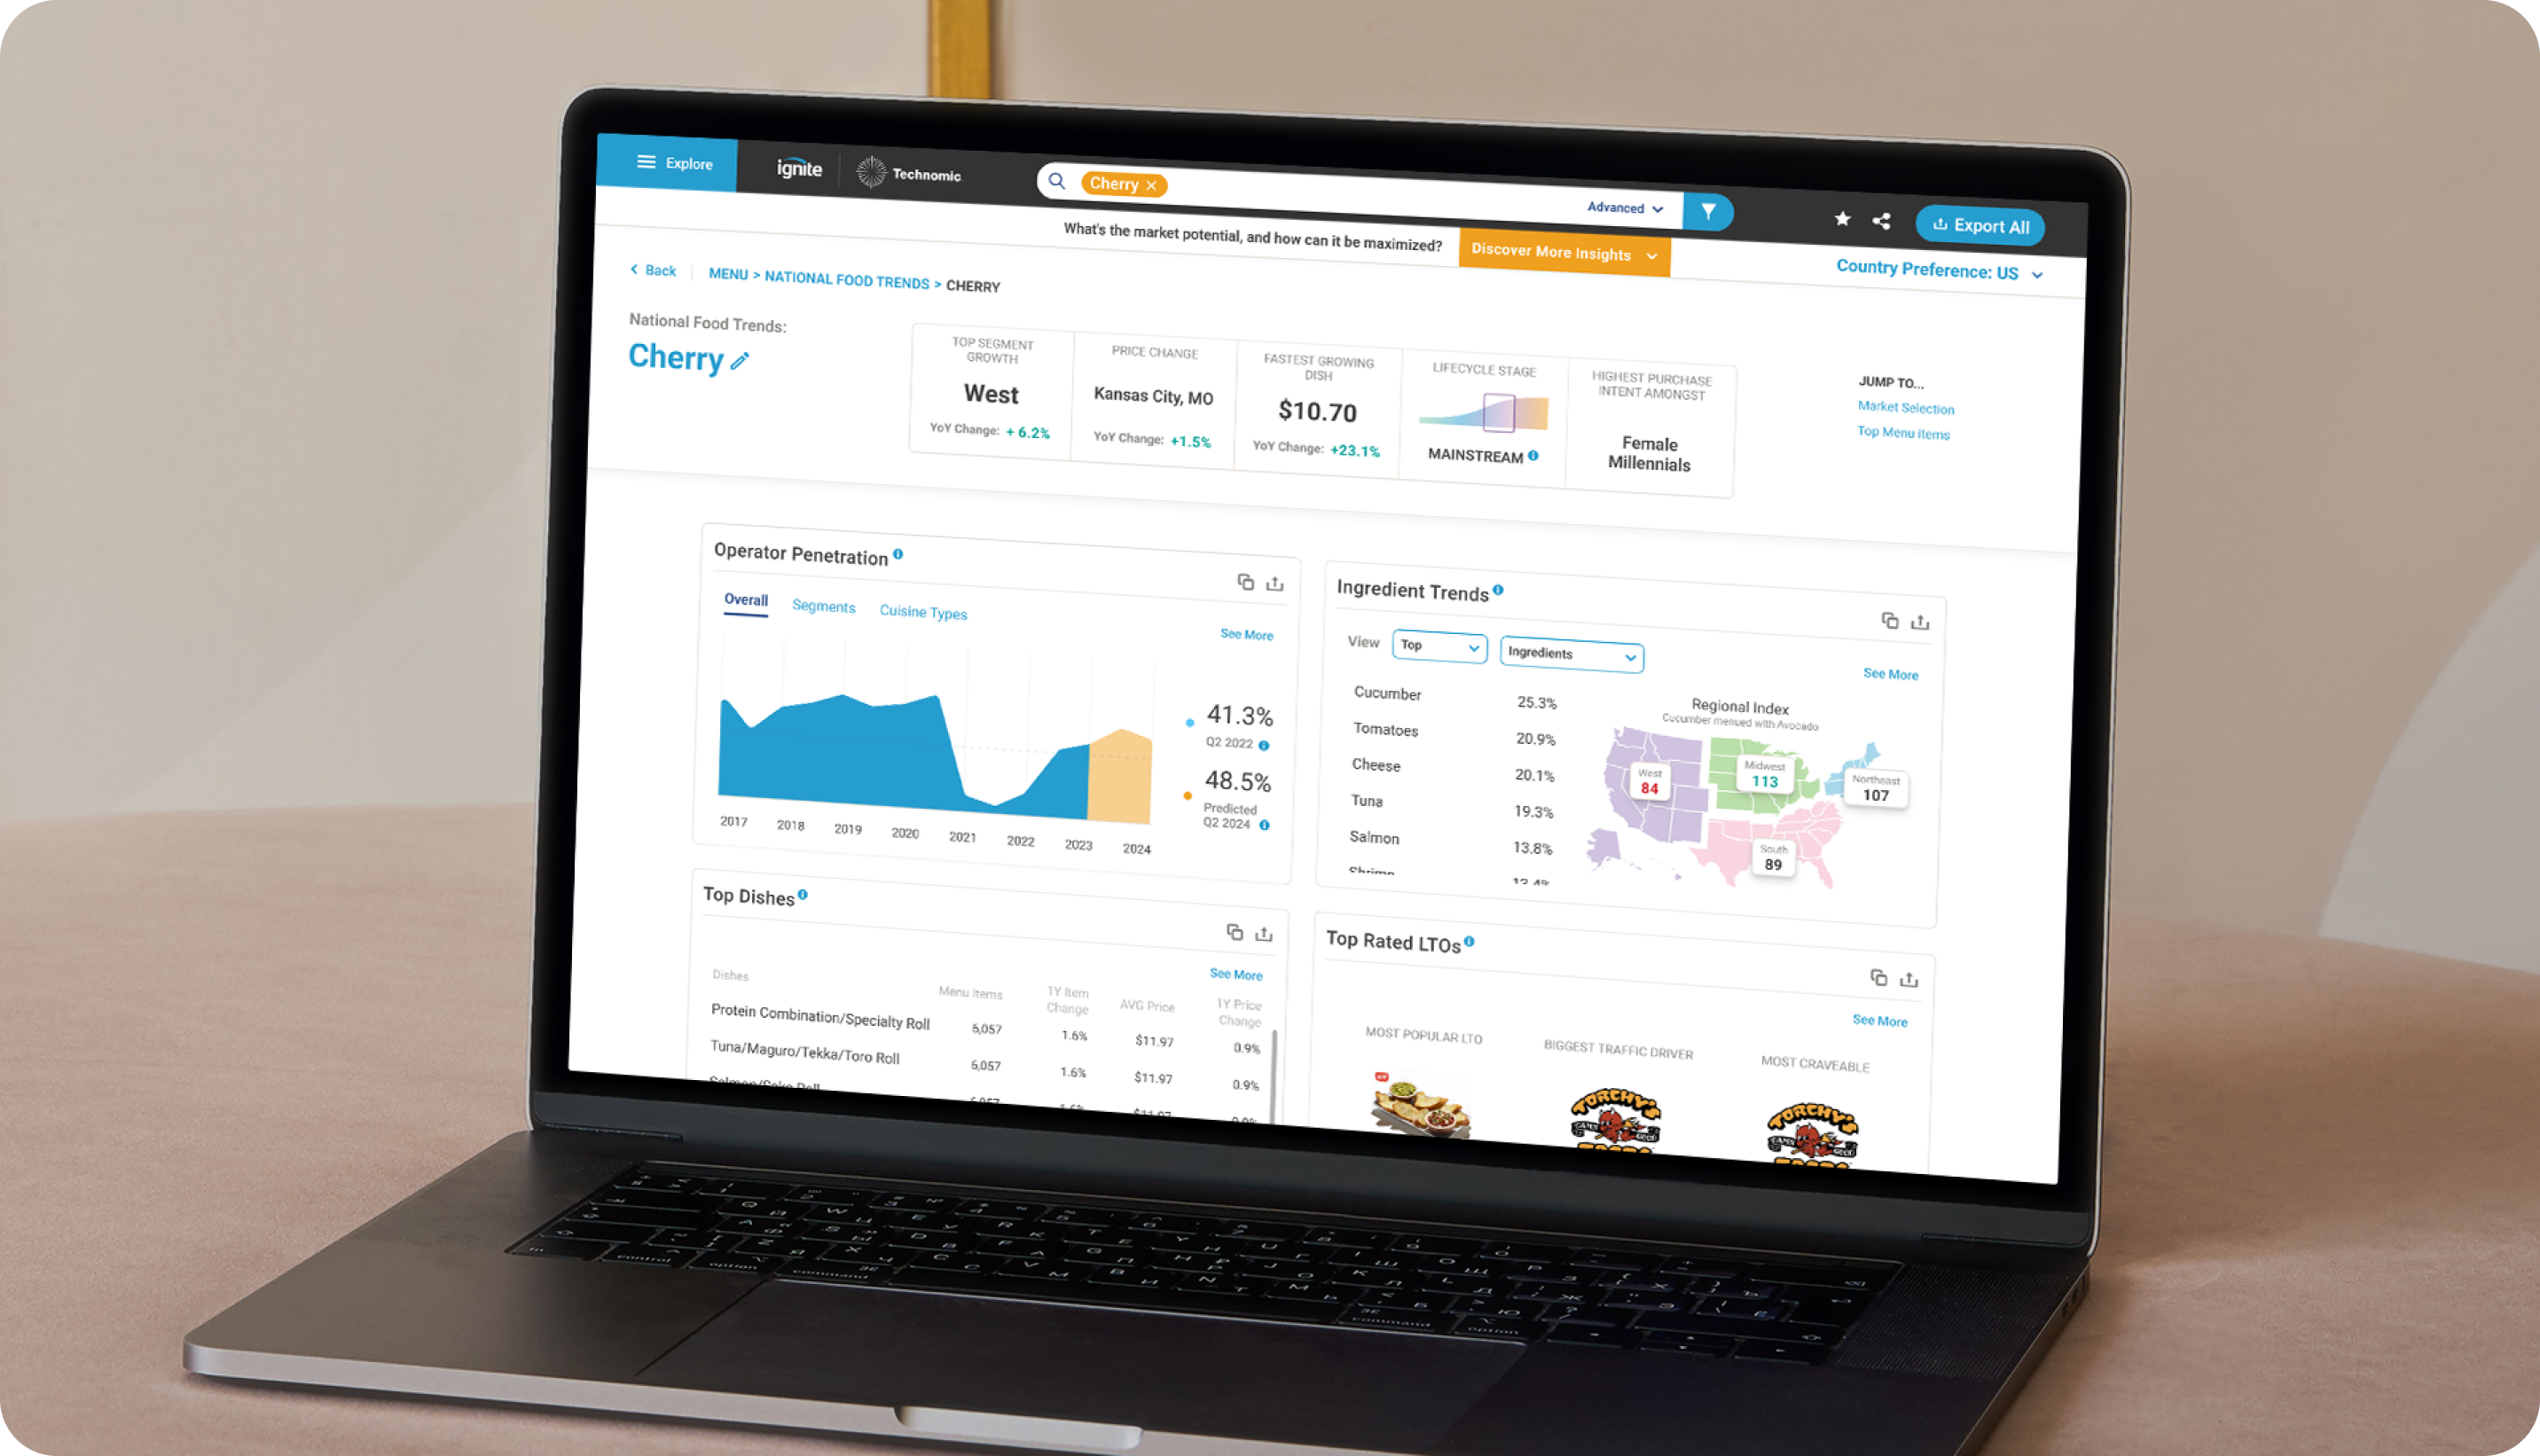
Technomic’s platform had a wealth of information, but the data was arranged in a way that was unreadable to their users. Technomic turned to us to create an intuitive platform that didn’t require training to use.
Making sense of the data
Technomic’s platform had a wealth of information, but the data was arranged in a way that was unreadable to their users. Technomic turned to us to create an intuitive platform that didn’t require training to use.
Making sense of the data
Technomic’s platform had a wealth of information, but the data was arranged in a way that was unreadable to their users. Technomic turned to us to create an intuitive platform that didn’t require training to use.
Making sense of the data
Technomic’s platform had a wealth of information, but the data was arranged in a way that was unreadable to their users. Technomic turned to us to create an intuitive platform that didn’t require training to use.

Laying the foundations
As the first step in the redesign of the platform, we gathered client and user feedback to identify the major pain points and key use cases. From there, we created an interaction framework from which we could build a cohesive experience. We focused on the consumer dashboard, and after it was positively received by users, we expanded the redesign to other workflows.
The Core Experience Pillars

Key objectives
Designing with intelligent interactions
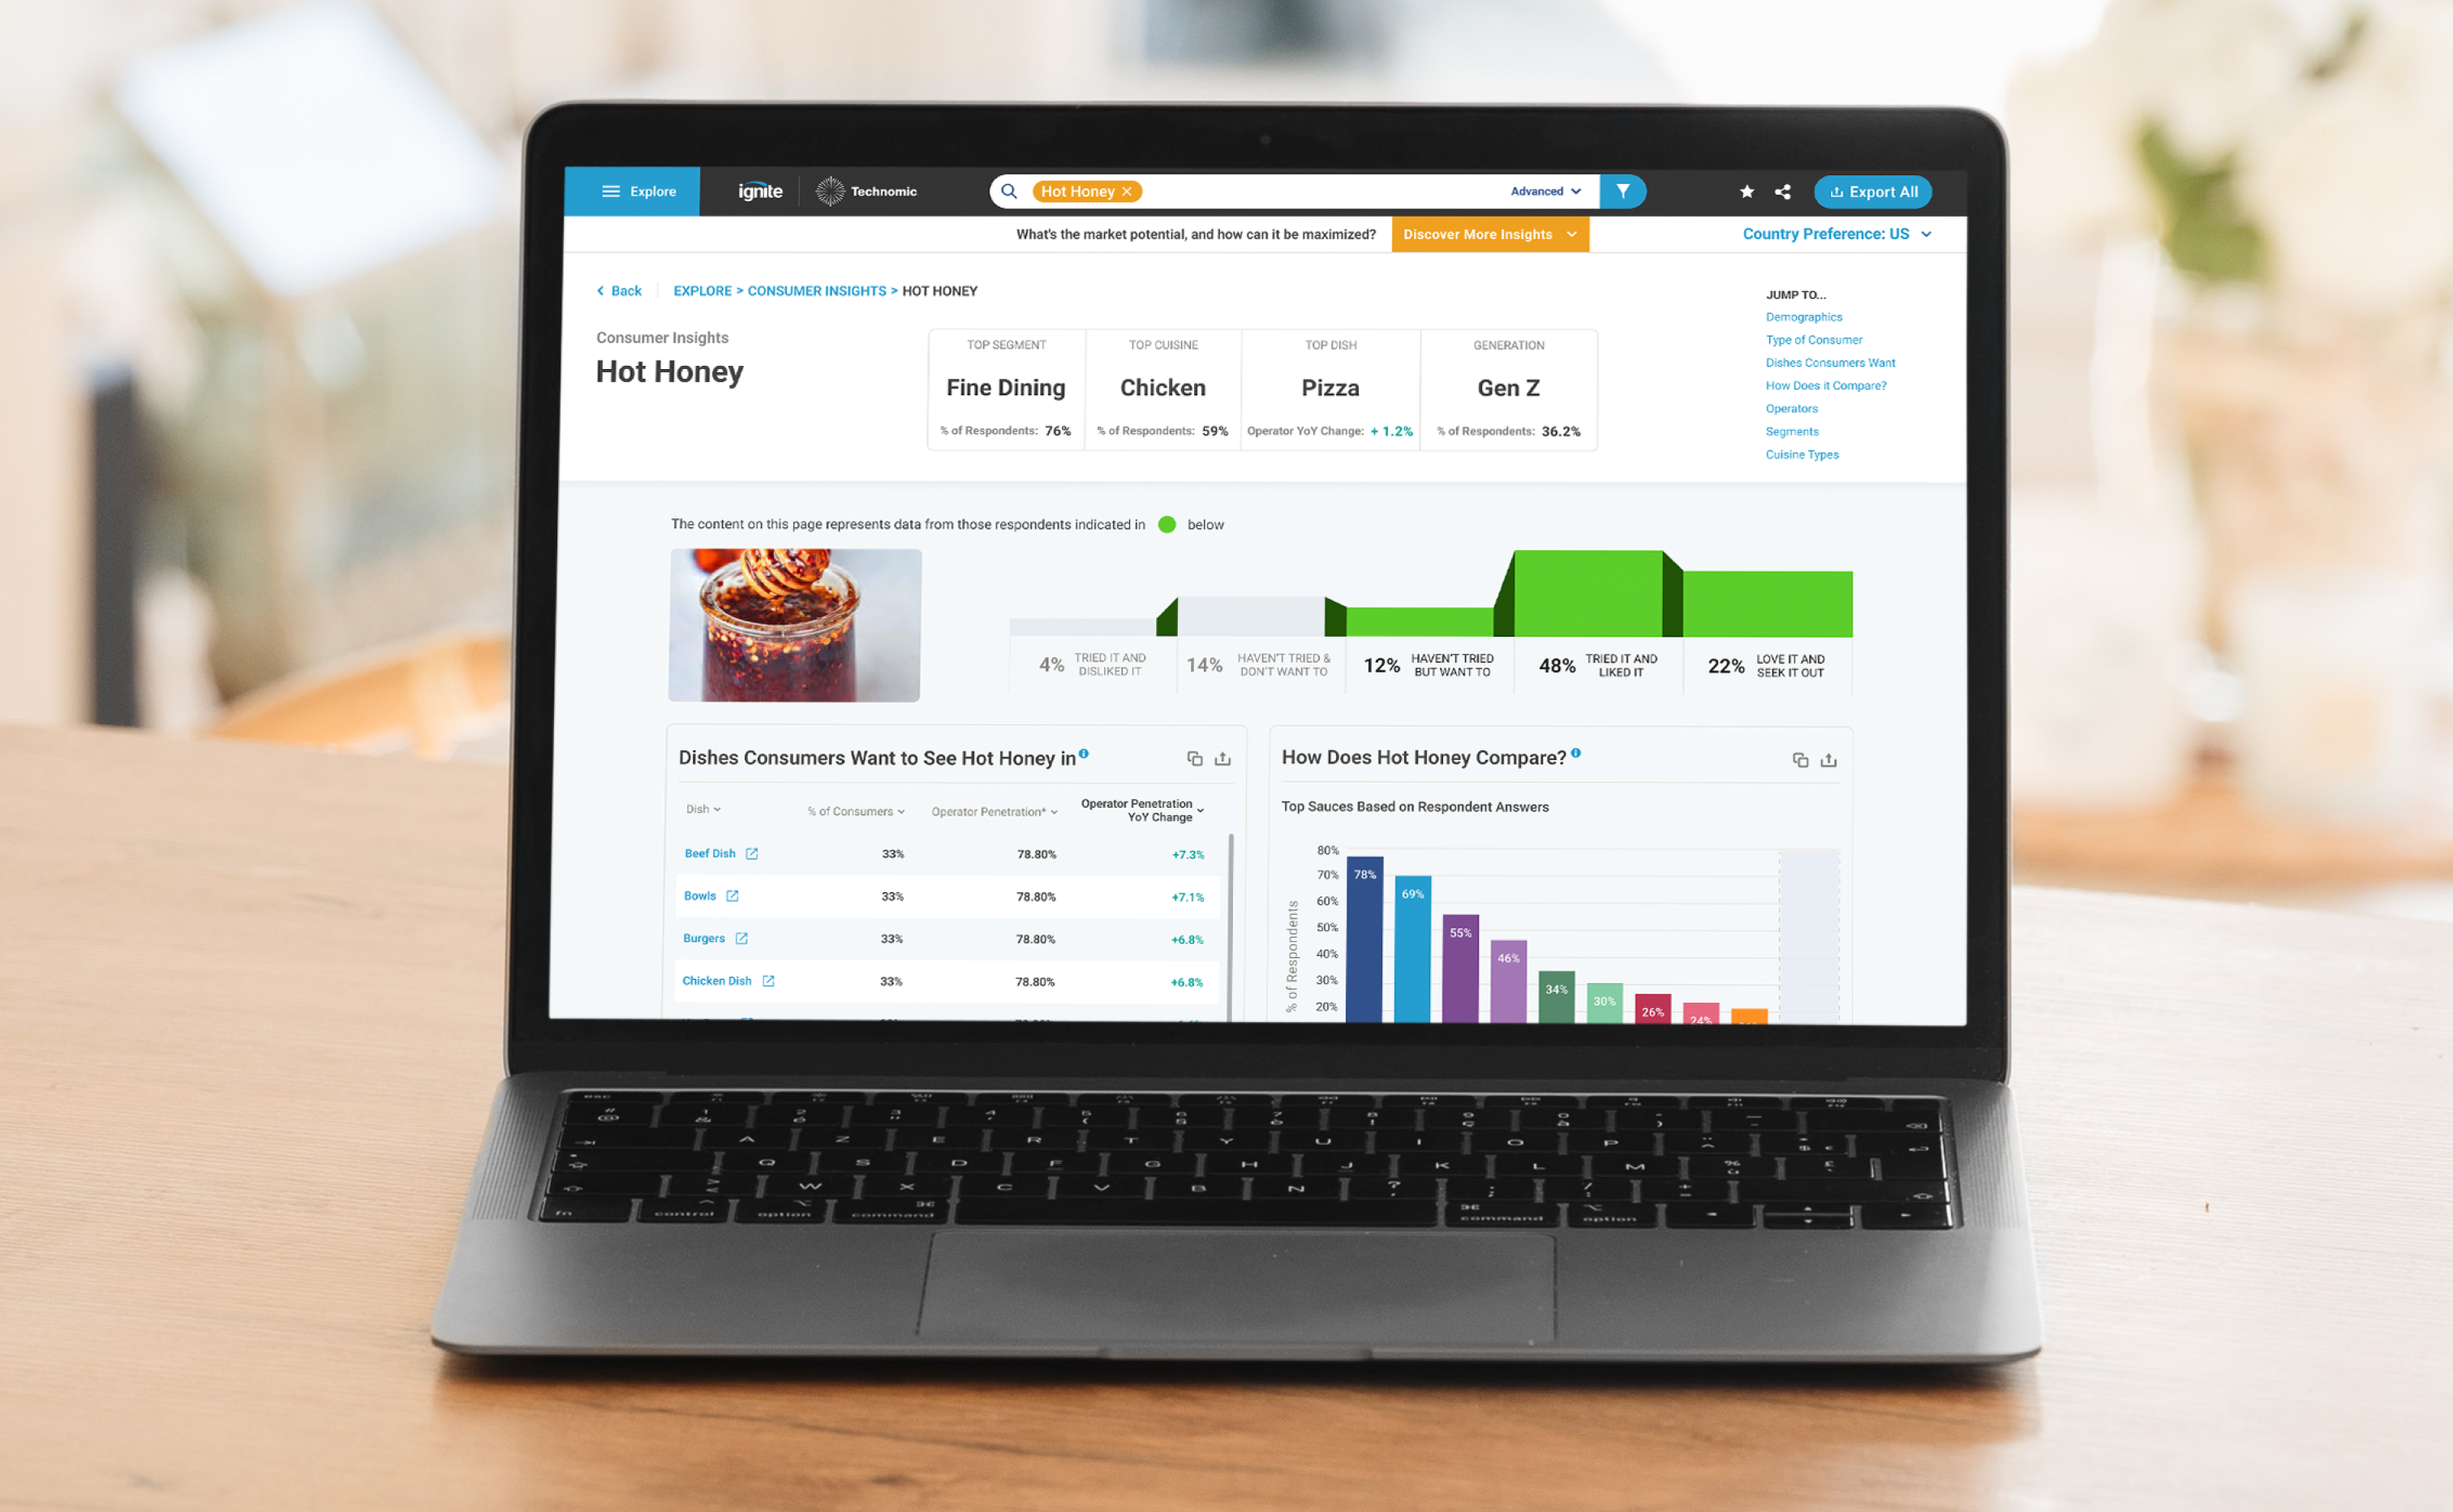
Working with the Technomic team, we delivered visual design concepts that presented the data and interaction paradigms in different solutions.
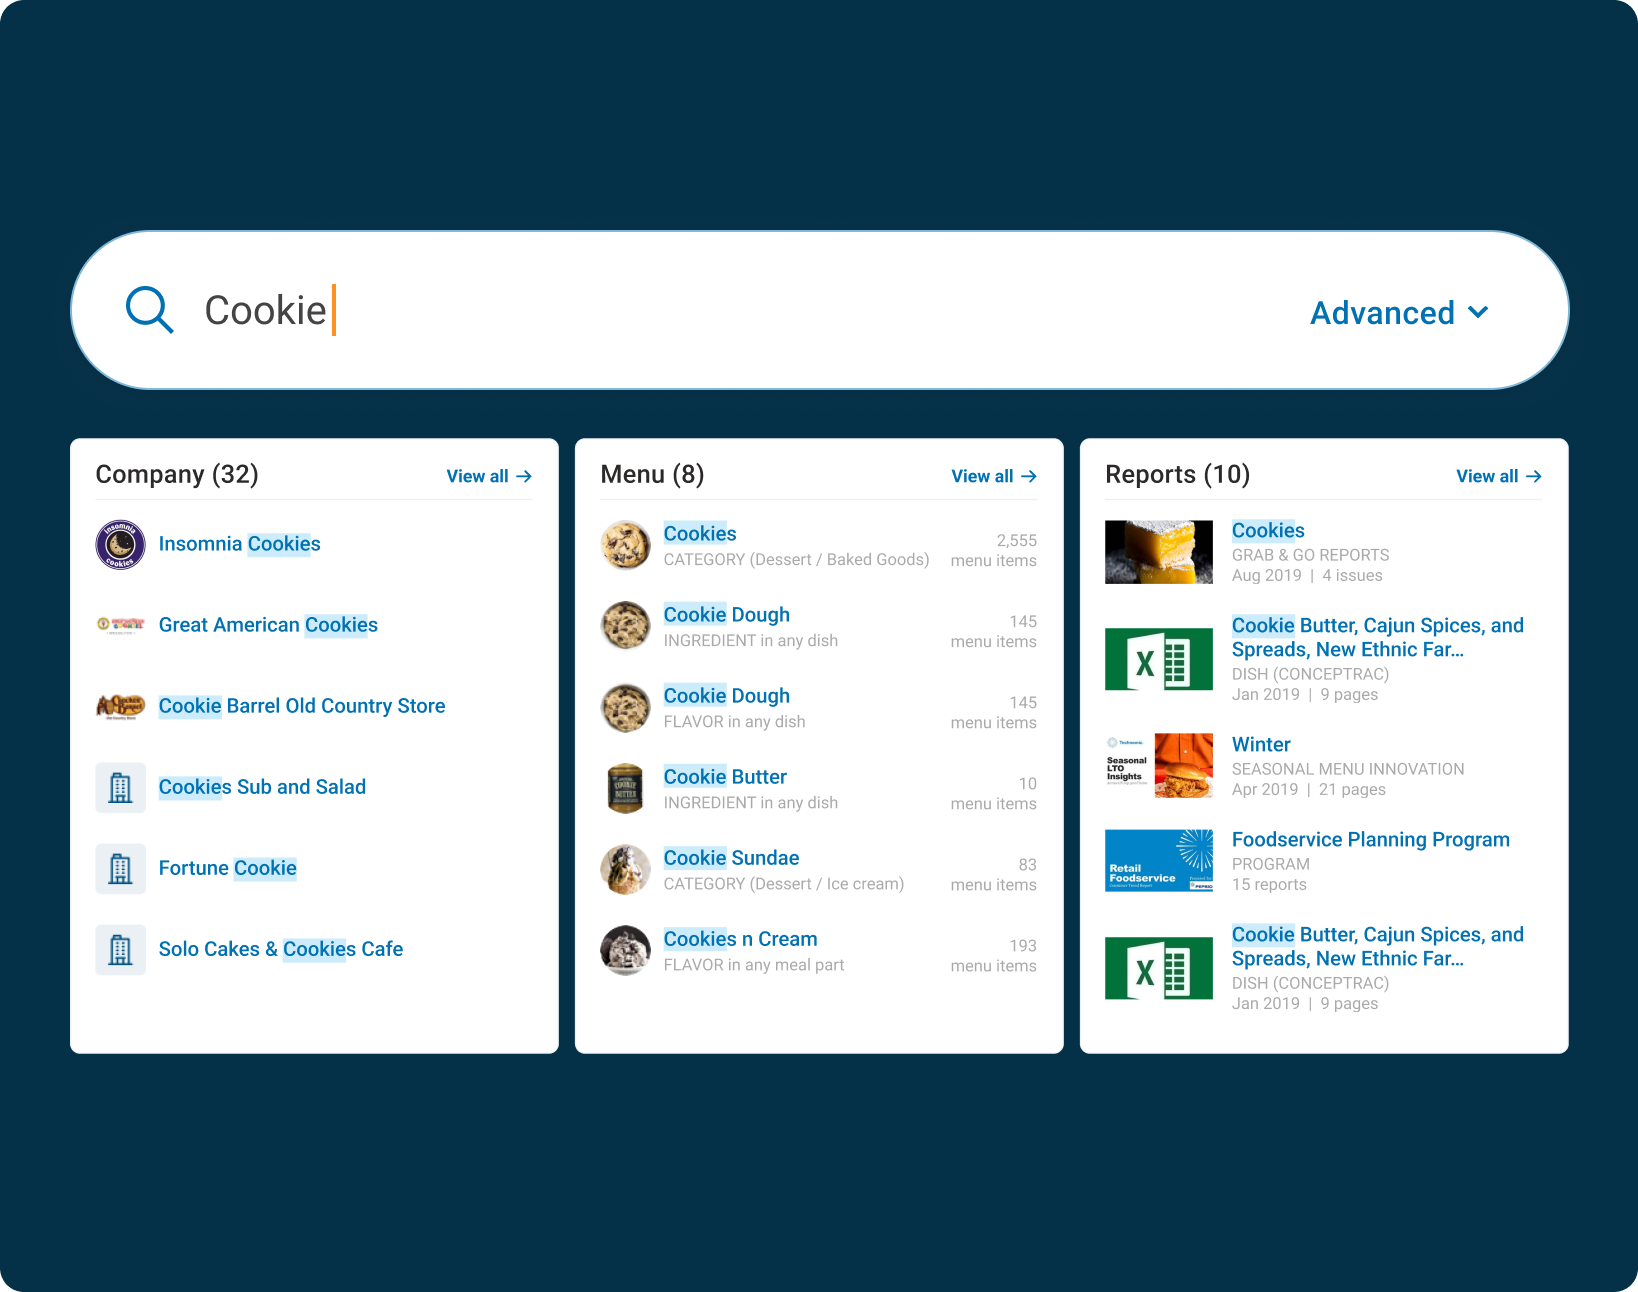
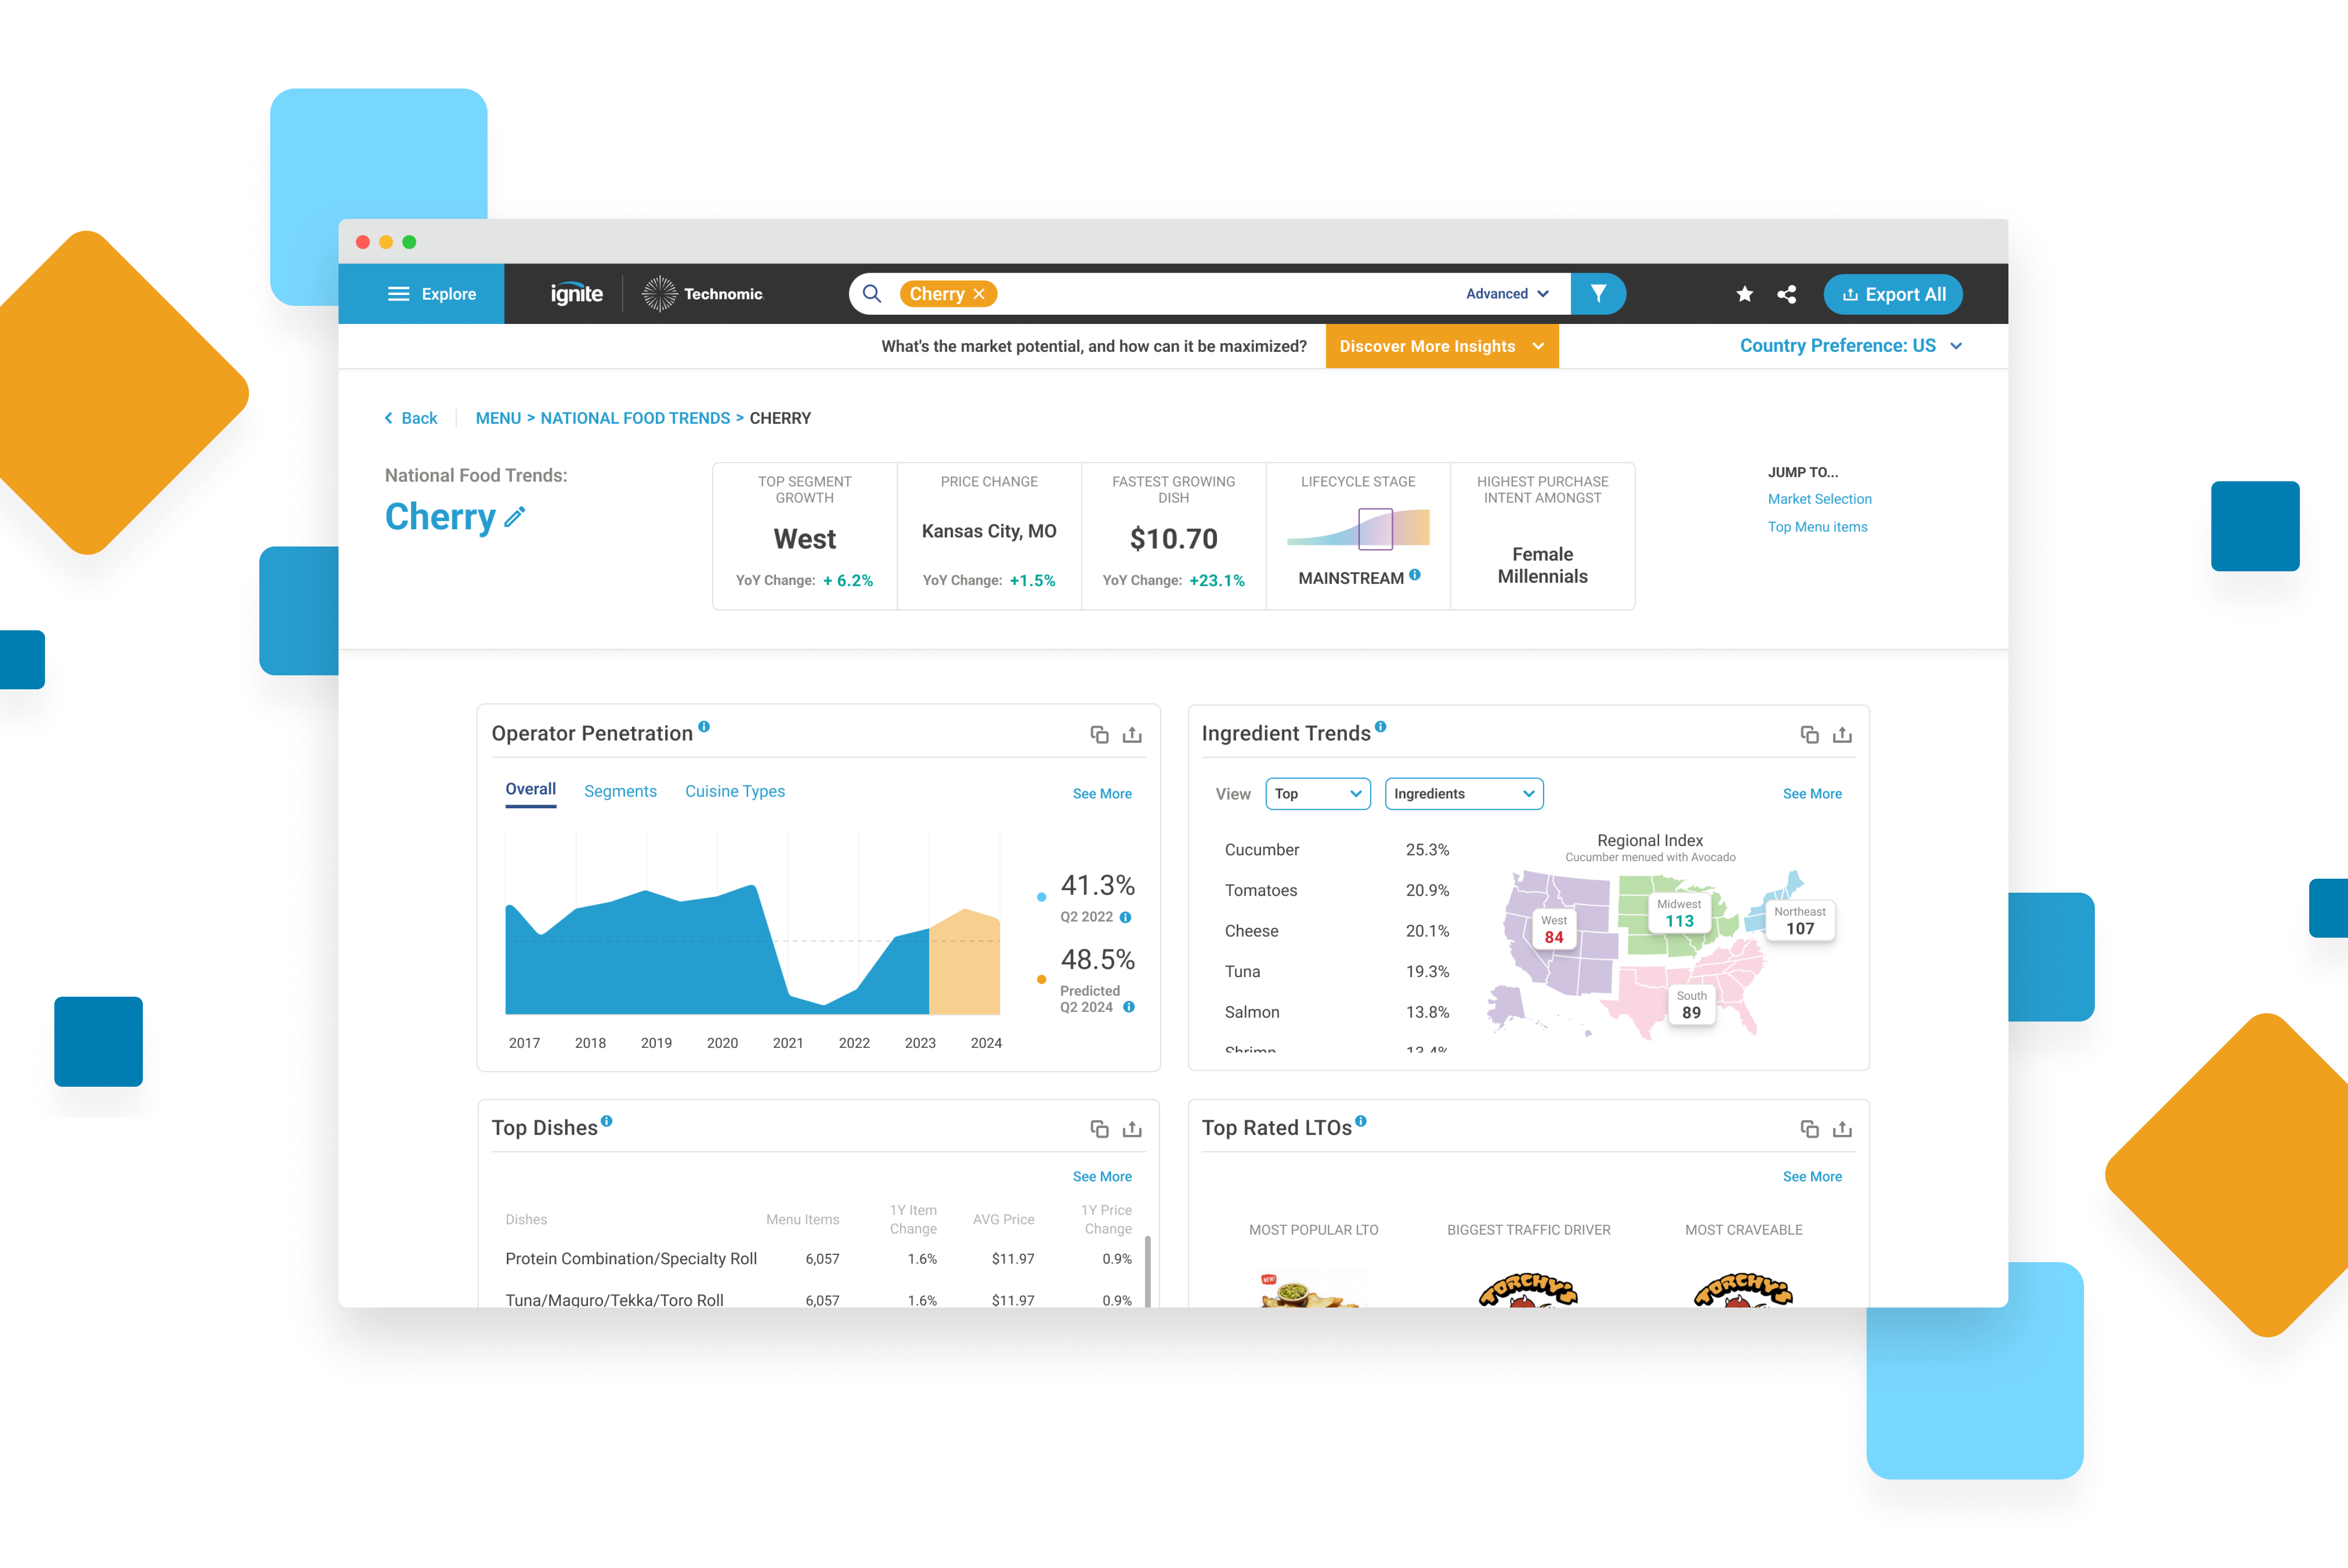
One global search
We combined the existing product’s many searches into one global search with powerful filters and intuitive controls.
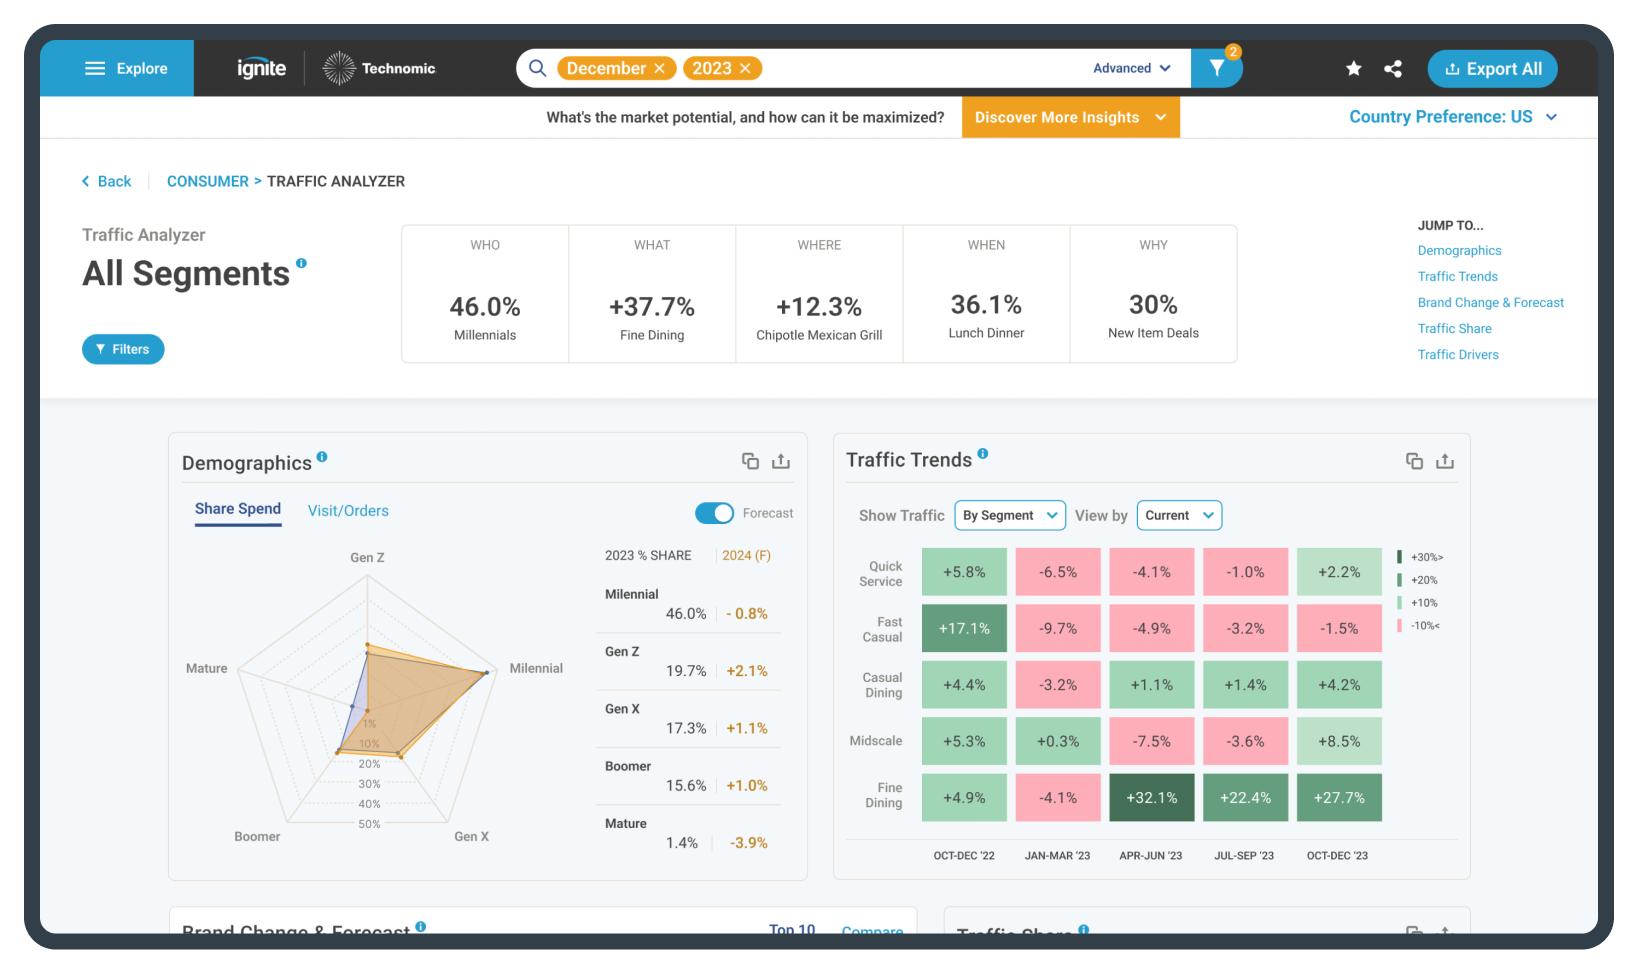
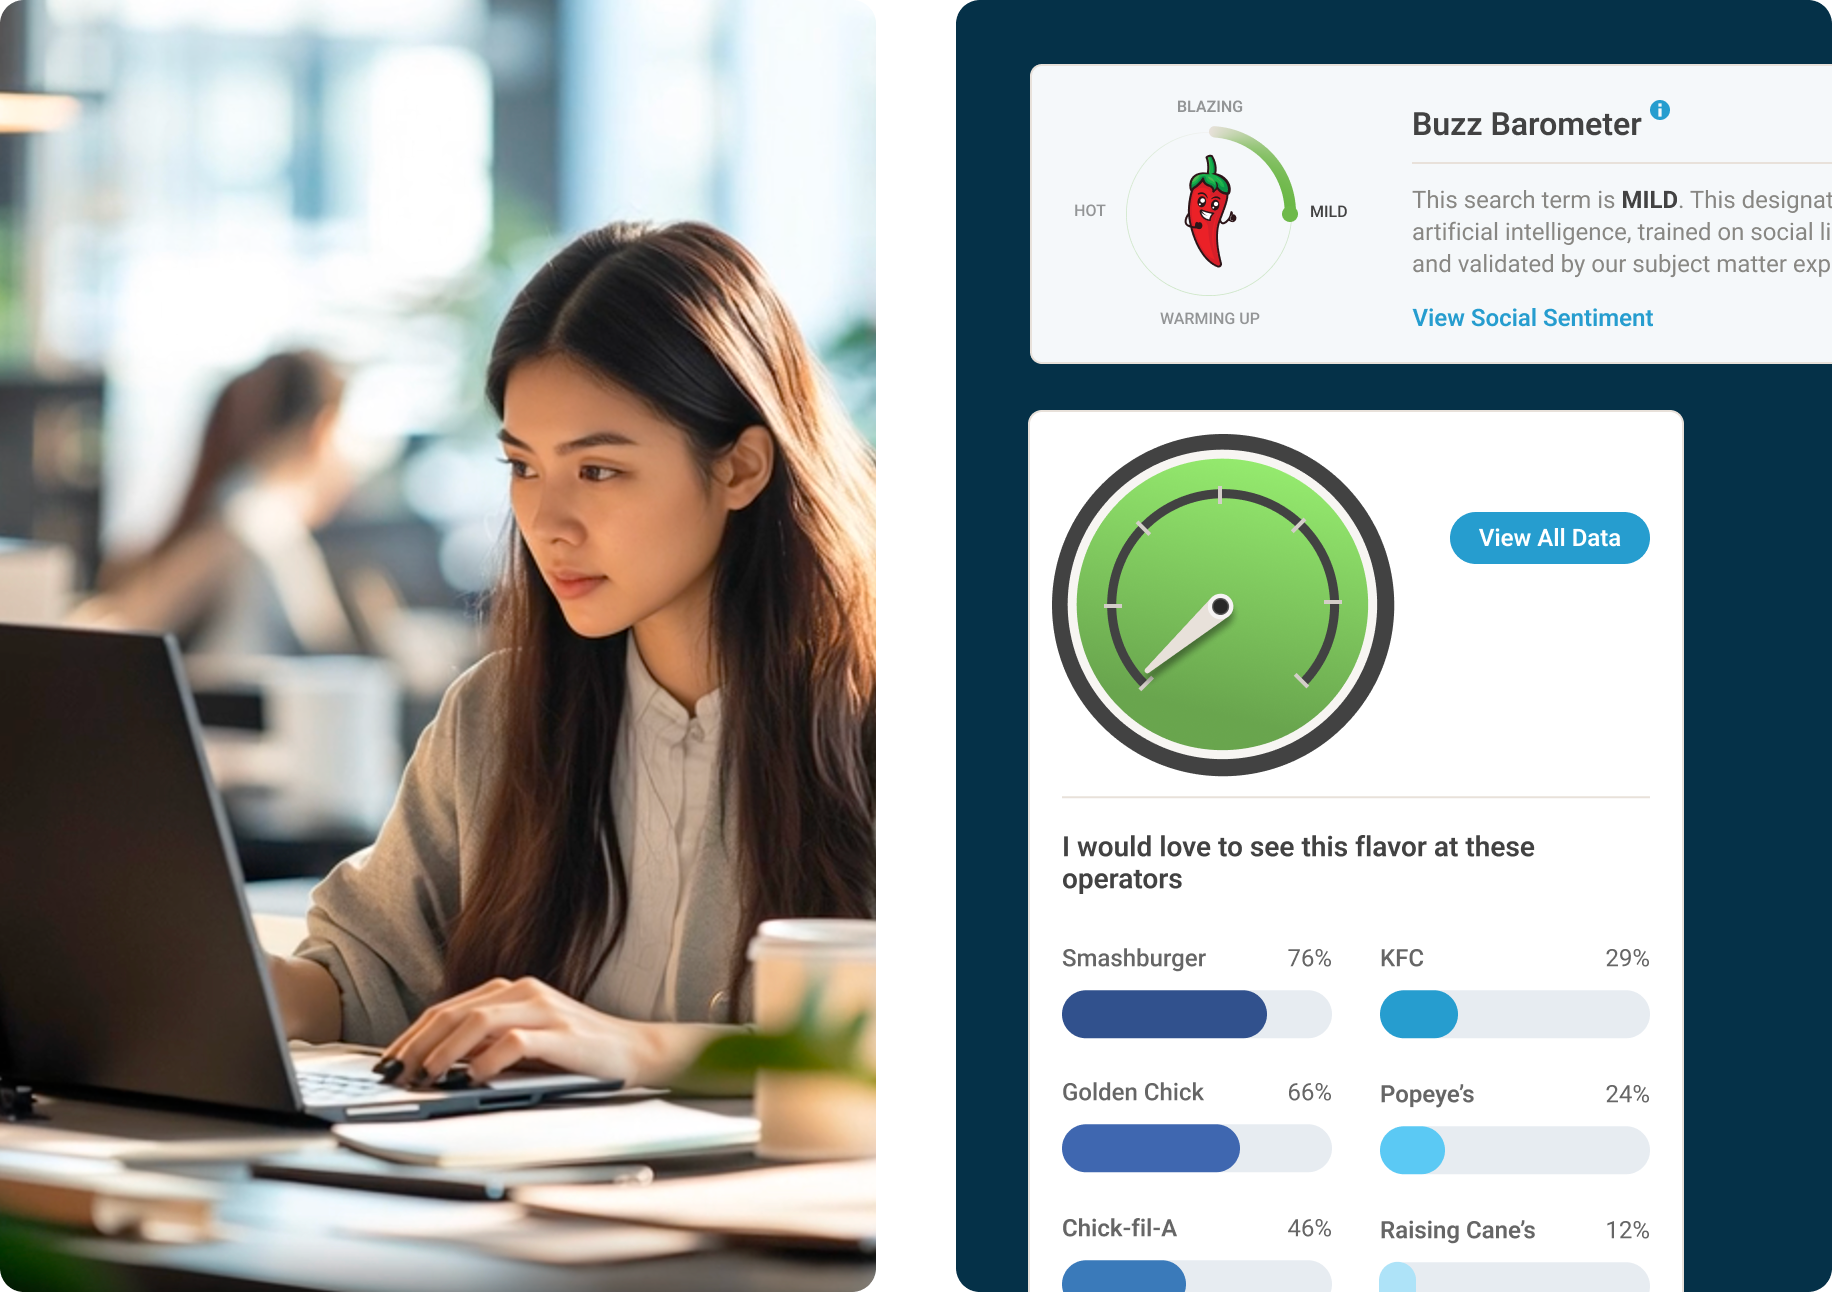
Surfacing insights
Instead of forcing users to mine for information, the new design explains the trends and what the data might mean for them.
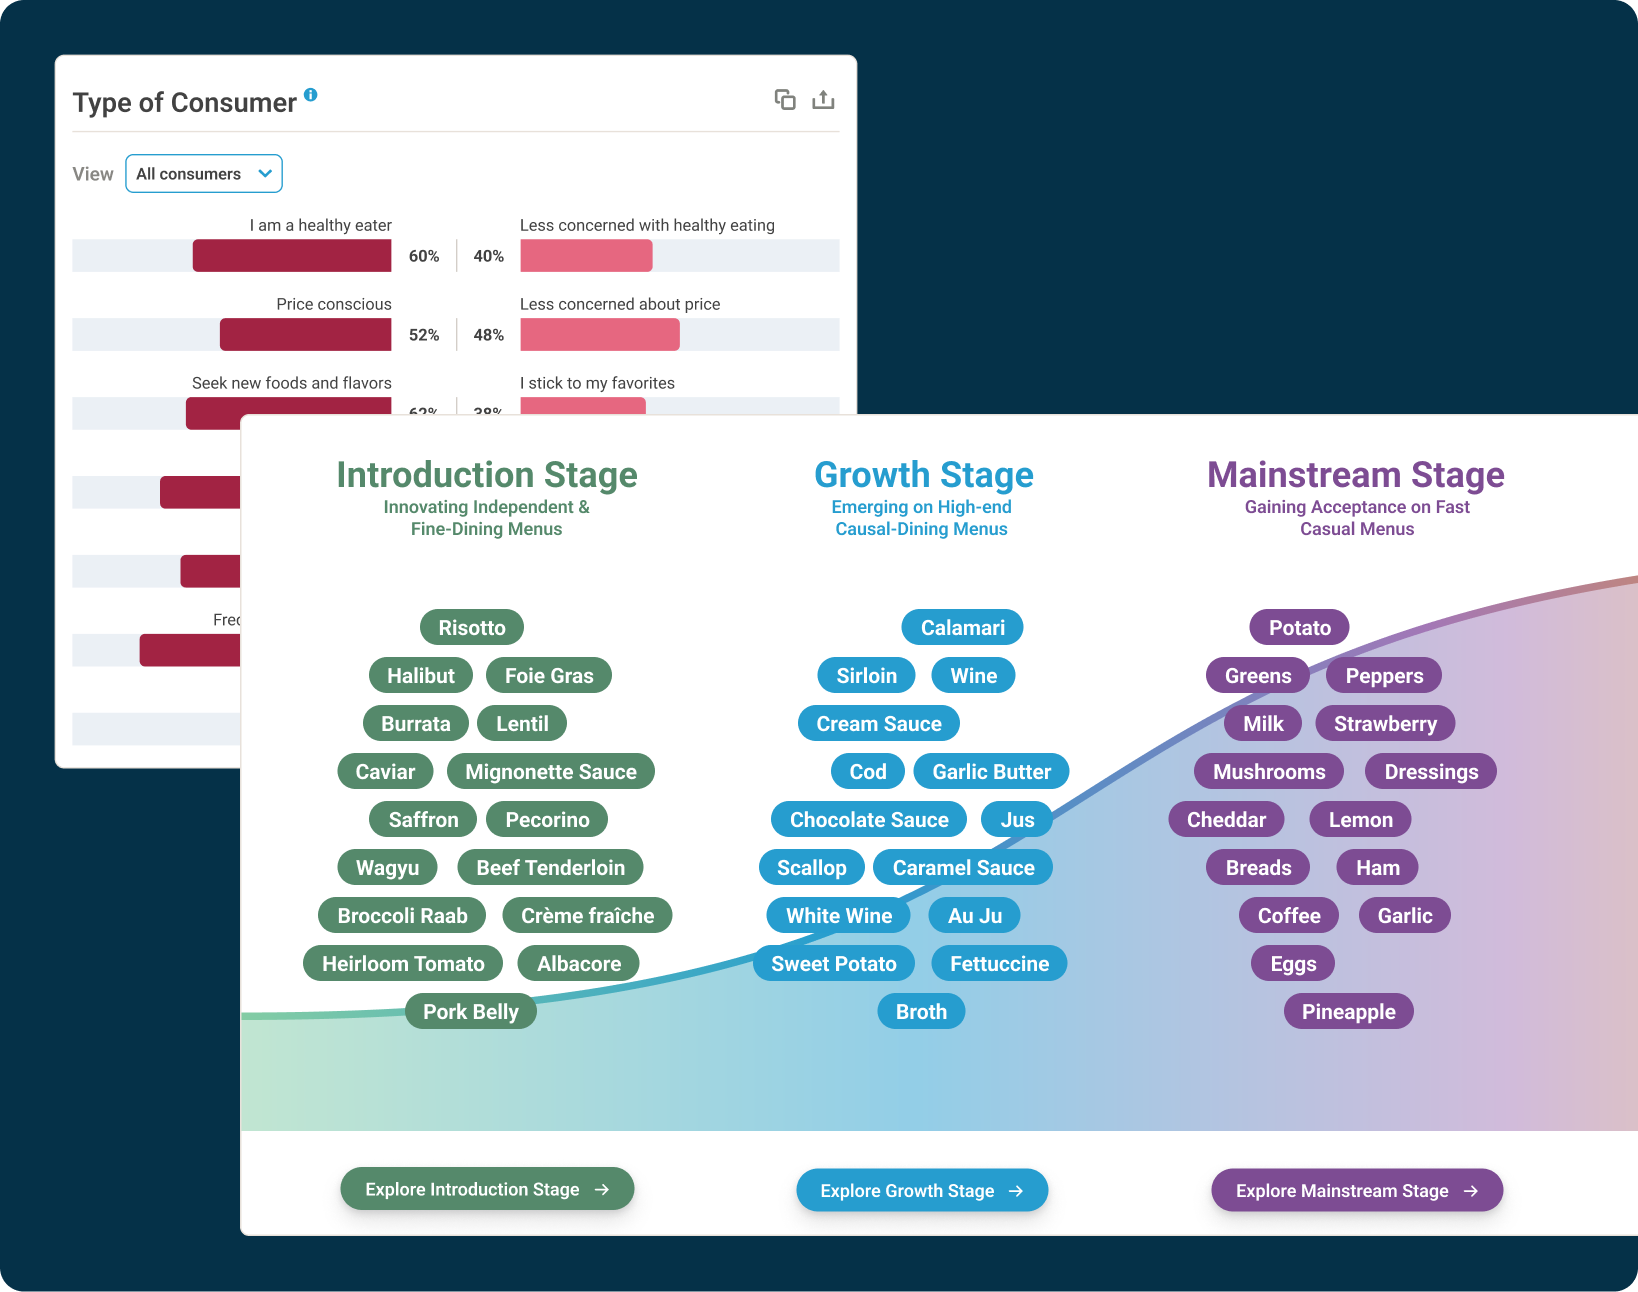
Engaging visualizations
In addition to the standard bar and pie charts, we used custom and specialized data visualization to better display the data in a compelling way that would make insights apparent and lead to new discoveries.